Abstrak
Pemilihan material untuk wadah minum seringkali hanya didasarkan pada merek, estetika, atau perkiraan daya tahan. Namun, penggunaan di dunia nyata memperkenalkan serangkaian variabel yang jauh lebih kompleks: suhu, kimia minuman, frekuensi pembersihan, dan interaksi permukaan seiring waktu.
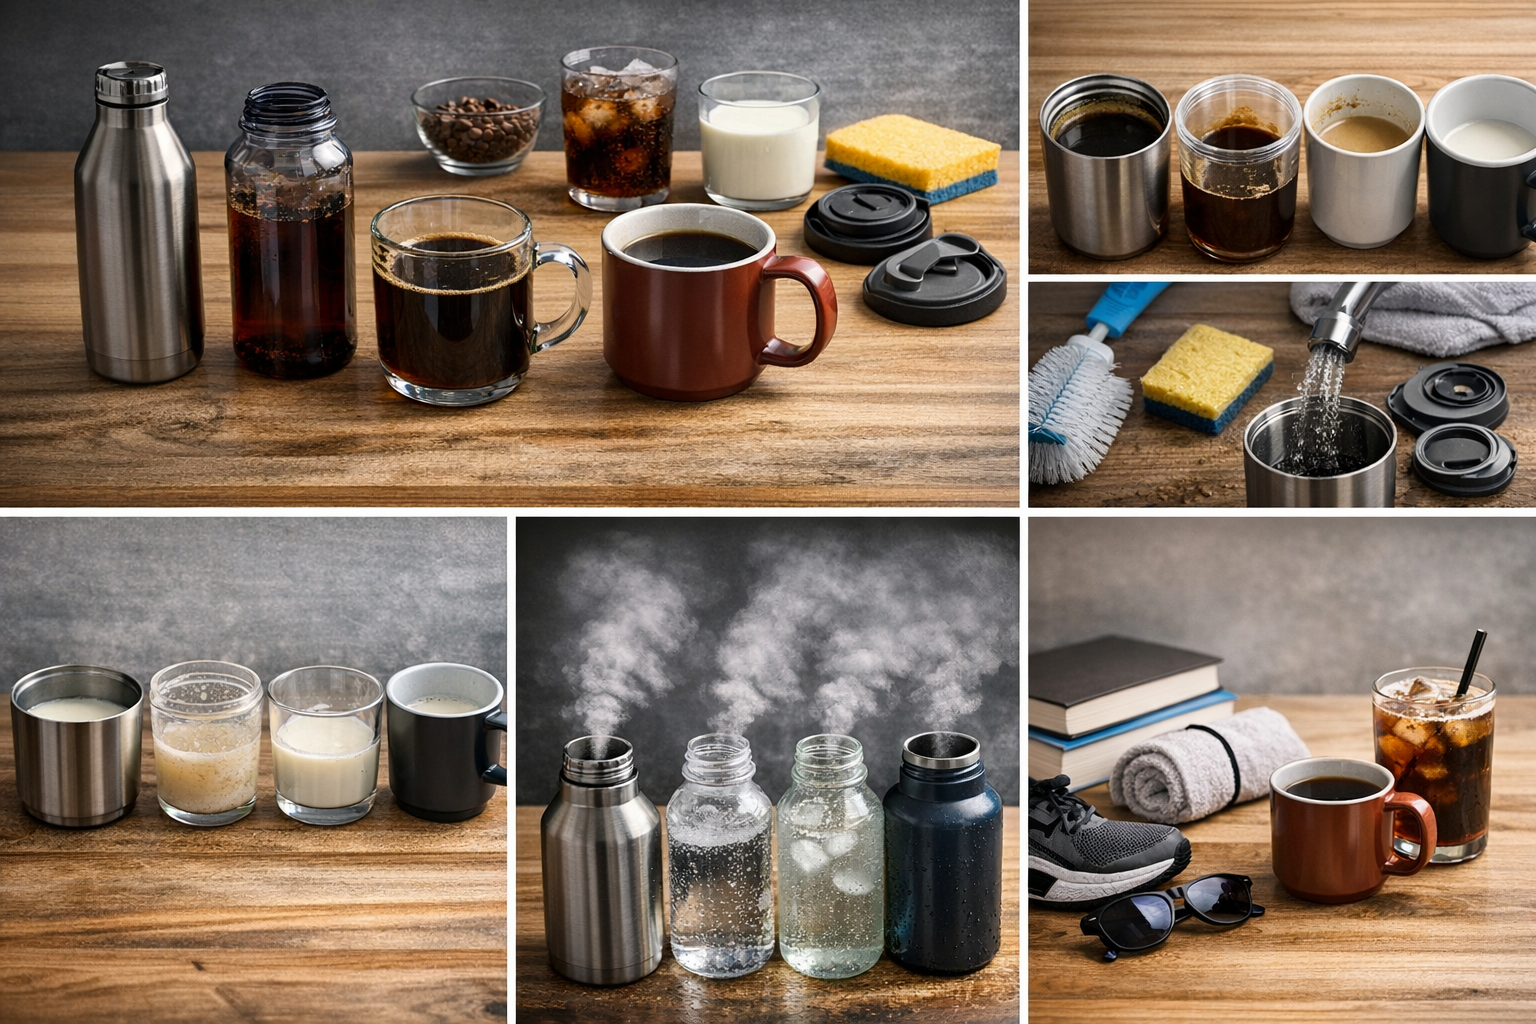
Laporan ini mengevaluasi lima material wadah minum yang banyak digunakan—baja tahan karat 304, baja tahan karat 316, plastik Tritan, kaca, dan interior berlapis keramik—dalam skenario minuman umum termasuk kopi, minuman berkarbonasi, susu, dan air.
Alih-alih hanya mengandalkan sifat material secara teoritis, laporan ini mengadopsi kerangka kerja kinerja berbasis skenario, yang mensimulasikan kondisi penggunaan realistis dan mengevaluasi hasilnya berdasarkan empat metrik utama:
- Retensi Bau
- Upaya Pembersihan
- Stabilitas Permukaan (Noda / Korosi)
- Integritas Rasa
Tujuannya sederhana: mengubah pemilihan wadah minum dari preferensi subjektif menjadi model keputusan berbasis kasus penggunaan.
1. Metodologi
1.1 Kerangka Pengujian
Untuk mendekati penggunaan di kehidupan nyata, material dievaluasi di bawah empat kategori minuman:
| Jenis Minuman | Karakteristik Kimia Utama |
|---|---|
| Kopi | Keasaman ringan + minyak |
| Minuman Berkarbonasi | Asam karbonat + tekanan gas terlarut |
| Susu | Kandungan protein + lemak |
| Air | Baseline netral |
Setiap material diekspos dalam tiga interval waktu:
- Jangka pendek: 1 jam
- Jangka menengah: 12 jam
- Paparan diperpanjang: 24 jam
1.2 Metrik Evaluasi
Setiap material dinilai menggunakan sistem penilaian 1–5:
| Metrik | Deskripsi |
|---|---|
| Retensi Bau | Tingkat bau sisa setelah dibilas |
| Upaya Pembersihan | Waktu dan upaya mekanis yang diperlukan |
| Stabilitas Permukaan | Noda terlihat atau reaksi material |
| Gangguan Rasa | Dampak pada minuman berikutnya |
2. Gambaran Umum Material
2.1 Baja Tahan Karat 304
- Standar industri untuk botol berinsulasi
- Ketahanan korosi yang kuat dalam kondisi netral
- Sensitivitas potensial terhadap lingkungan asam selama penggunaan jangka panjang
2.2 Baja Tahan Karat 316
- Peningkatan ketahanan korosi karena kandungan molibdenum
- Umumnya digunakan dalam aplikasi medis dan kelautan
- Kinerja yang lebih baik dalam lingkungan asam dan salin
2.3 Plastik Tritan
- Kopoliester bebas BPA yang banyak digunakan dalam botol ringan
- Ketahanan benturan tinggi dan transparansi
- Cenderung menyerap bau mikro seiring waktu
2.4 Kaca
- Inert secara kimiawi dan non-pori
- Tidak ada transfer rasa
- Kerapuhan membatasi portabilitas dan kemampuan insulasi
2.5 Interior Berlapis Keramik
- Struktur hibrida: eksterior logam + lapisan dalam inert
- Dirancang untuk meniru kenetralan seperti kaca
- Semakin banyak diadopsi dalam segmen wadah minum premium
3. Hasil Kinerja
3.1 Skenario Kopi (Lingkungan Kompleksitas Tinggi)
Kopi menyajikan salah satu kondisi pengujian yang paling menantang karena kombinasi keasaman dan minyaknya.
Tren yang Diamati:
- Plastik Tritan menunjukkan retensi bau tertinggi, terutama setelah paparan 12–24 jam
- Baja Tahan Karat 304 menunjukkan retensi bau sedang, meningkat dengan penggunaan berulang
- Baja Tahan Karat 316 berkinerja sedikit lebih baik, dengan penumpukan jangka panjang yang berkurang
- Kaca dan Interior Berlapis Keramik menunjukkan retensi bau mendekati nol
Wawasan Utama:
Retensi bau didorong tidak hanya oleh porositas material tetapi juga oleh mikrostruktur permukaan dan perilaku adhesi minyak.
3.2 Skenario Minuman Berkarbonasi
Minuman berkarbonasi memperkenalkan variabel keasaman dan tekanan internal.
Tren yang Diamati:
- Baja tahan karat mempertahankan stabilitas struktural tetapi kadang-kadang mengubah persepsi rasa setelah paparan yang lama
- Tritan menunjukkan sedikit bau yang tertinggal
- Kaca dan bahan berlapis keramik paling efektif dalam menjaga integritas rasa
Wawasan Utama:
Bahkan bahan yang stabil secara kimiawi dapat memengaruhi ketajaman karbonasi yang dirasakan, terutama dalam lingkungan tertutup.
3.3 Skenario Susu / Produk Susu (Risiko Residu Tinggi)
Susu mengandung protein dan lemak yang rentan membentuk residu.
Tren yang Diamati:
- Semua bahan memerlukan pembersihan segera untuk mencegah timbulnya bau
- Baja tahan karat (terutama interior yang tidak diolah) menunjukkan risiko bau persisten yang lebih tinggi jika tidak segera dibersihkan
- Tritan menyerap bau sisa lebih cepat daripada bahan lain
- Kaca dan lapisan keramik tetap paling mudah dikembalikan ke kondisi netral
Wawasan Utama:
Perilaku pembersihan memiliki dampak yang lebih besar daripada pemilihan bahan dalam skenario susu.
3.4 Air (Skenario Dasar)
Dalam kondisi netral:
- Perbedaan kinerja antar bahan sangat minimal
- Kenetralan rasa tetap terjaga di semua kategori
- Upaya pembersihan secara keseluruhan paling rendah
Wawasan Utama:
Diferensiasi material menjadi relevan hanya pada cairan dengan komposisi kimia kompleks.
4. Analisis Pembersihan & Pemeliharaan
4.1 Peringkat Kesulitan Pembersihan (Tertinggi → Terendah)
- Plastik Tritan
- Baja Tahan Karat Standar
- Baja Tahan Karat 316
- Interior Berlapis Keramik
- Kaca
4.2 Pengamatan Utama
- Bukaan sempit dan struktur tutup yang kompleks meningkatkan kesulitan pembersihan lebih dari material itu sendiri
- Residu berbasis minyak (kopi) dan residu protein (susu) memerlukan strategi pembersihan yang berbeda
- Pembersihan yang tidak tepat secara berulang mempercepat retensi bau terlepas dari materialnya
5. Peringkat Retensi Bau
Dari tertinggi ke terendah:
- Plastik Tritan
- Baja Tahan Karat 304
- Baja Tahan Karat 316
- Interior Berlapis Keramik
- Kaca
6. Rekomendasi Berbasis Skenario
Daripada mengidentifikasi material "terbaik", pemilihan harus selaras dengan pola penggunaan:
| Kasus Penggunaan | Material yang Direkomendasikan |
|---|---|
| Kopi Harian | Berlapis Keramik / Kaca |
| Luar Ruangan / Olahraga | Tritan / Baja Tahan Karat |
| Susu / Anak-anak | Kaca / Berlapis Keramik |
| Hidrasi Umum | Material apa pun |
7. Poin-Poin Penting
- Tidak ada satu pun material yang dominan di semua skenario
- Komposisi minuman memainkan peran yang lebih besar daripada yang biasa diasumsikan
- Retensi bau bersifat kumulatif dan bergantung pada perilaku
- Rekayasa permukaan (pelapis) muncul sebagai arah inovasi utama
8. Batasan
- Hasil didasarkan pada simulasi skenario terkontrol, bukan studi lapangan jangka panjang
- Variasi dalam kualitas manufaktur (misalnya, pemolesan, ketebalan lapisan) dapat memengaruhi hasil
- Kebiasaan pembersihan pengguna secara signifikan memengaruhi kinerja dunia nyata
Referensi & Sumber Data
Untuk memastikan keandalan dan keselarasan dengan ilmu material dan penelitian keamanan pangan yang telah ditetapkan, sumber-sumber berikut menjadi dasar laporan ini:
- U.S. Food & Drug Administration (FDA) – Pedoman Bahan Kontak Makanan
- European Food Safety Authority (EFSA) – Bahan dalam Kontak dengan Makanan
- International Stainless Steel Forum (ISSF) – Sifat & Ketahanan Korosi Baja Tahan Karat
- Eastman Chemical Company – Lembar Data Teknis Tritan™ Copolyester
- Journal of Food Engineering – Studi tentang retensi bau dan adsorpsi permukaan
- Materials Science & Engineering Reports – Interaksi permukaan polimer dan logam
- World Health Organization (WHO) – Pedoman tentang bahan aman pangan
- ASTM International Standards – Tolok ukur kinerja dan pengujian material